Morning review:
Ladies and Gentlemen, today we are participating in the New World Quantitative Investment Decision System’s carefully selected quality stock building opportunities. By accurately grasping stable trading signals and adopting sound trading strategies, we can work together to steadily grow our wealth. Let’s seize this opportunity to realize greater success and gains together!
1. How is the direction of the stock index running today, and has the main operating strategy changed?
2. What is the logic of the high-quality stocks screened by the New World Quantitative Investment Decision System?
3. How are the stocks in my portfolio performing and how should I further optimize my portfolio.
I will share the above topics.
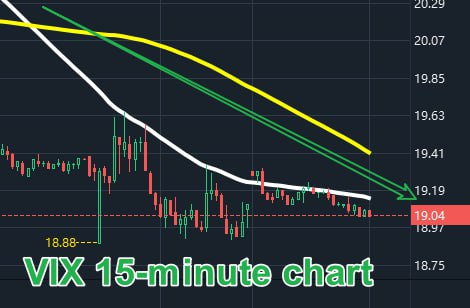
The VIX trend has an inverse relationship with the stock indices’ movements.
The VIX 15-minute chart shows a weak oscillating pattern, indicating that the current market sentiment is relatively stable, though still cautious. Its impact on today’s stock indices is minimal, and the stock index movements are expected to remain divergent.
This serves as a reminder that during trading, we must not only pursue potential profit returns but also place a strong emphasis on risk management. Staying vigilant is key to finding opportunities in a stable manner and achieving continuous wealth growth.
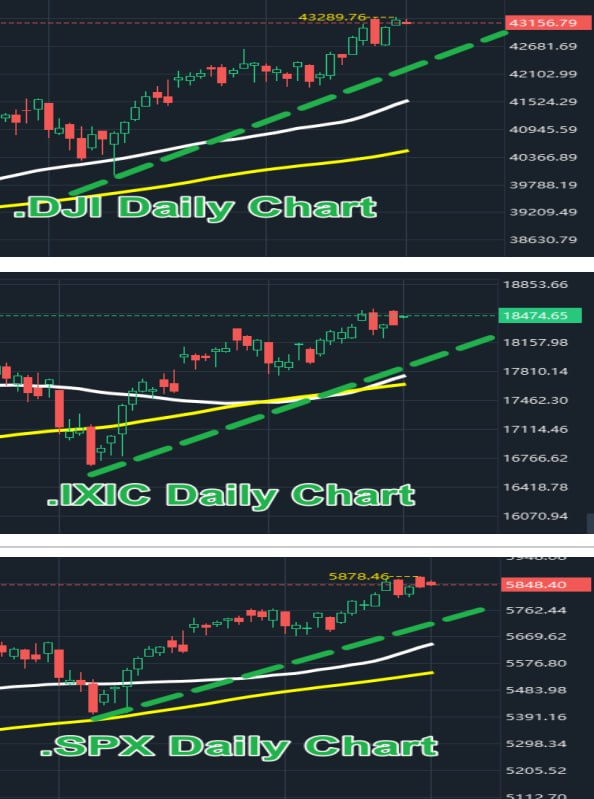
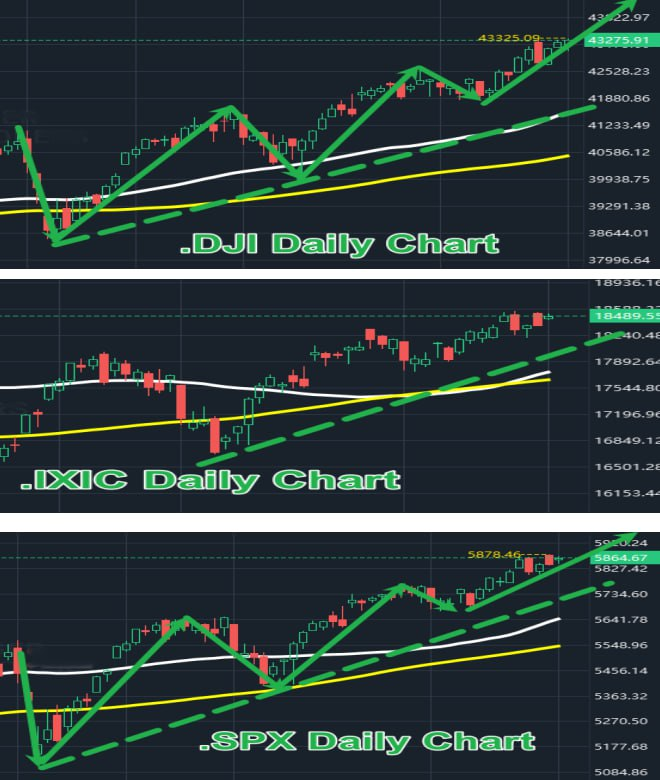
Now, let’s focus on the latest performance of the three major indices: The Dow Jones Industrial Average, Nasdaq, and S&P 500 are in a phase of high-level consolidation, with some brief pullbacks in price, but the overall trend remains healthy and stable. This market environment has minimal impact on the high-quality stocks we’re building positions in today, so everyone can confidently seize this opportunity, participate together, and move forward steadily.
Now, let’s focus on today’s synchronized stock-building of high-quality stocks and further explore the underlying logic behind their performance.
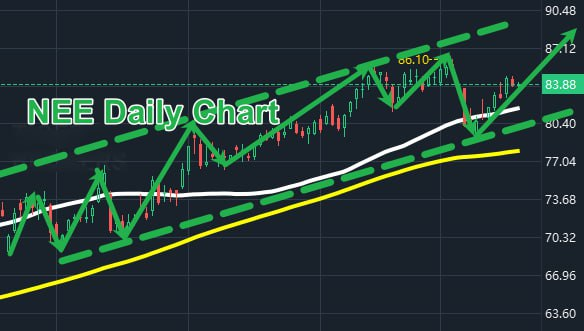
Fundamental analysis: This company is one of the largest power and energy infrastructure companies in North America and a leader in the renewable energy industry. Over the past five years, the company has achieved positive returns every year, with a return on assets of 3.42%, performing better than 75.56% of its peers in the industry.
Looking at the data from the past three years, the company’s average return on invested capital is in line with the industry average of 4.74%, demonstrating stable operating capabilities. Additionally, the company’s Altman-Z score is 1.20, better than 71.11% of its peers in the industry, reflecting strong financial health.
The company’s earnings per share have shown strong performance over the past few years, with an average annual growth rate of 10.50%. When compared to the current average price-to-earnings ratio of the S&P 500 at 31.77, the company’s valuation appears relatively inexpensive.
Finally, the company’s earnings rating is also high, further enhancing its appeal as an investment target.
Technical chart analysis: The company is overall in an upward channel, with a clear upward trend. Each time the price pulls back to the lower edge of the ascending channel, it forms a very strong rebound trend. Therefore, price pullbacks often present excellent entry opportunities.
In summary, both the fundamentals and technical charts show positive performance, so we have decided to participate in the trade with a 10% position.
You can now contact my assistant directly to receive the stock code and the best entry point. I want to emphasize again: if you have successfully participated in the trade, please send a screenshot of your transaction to my assistant. The assistant will help you track the stock’s movements in real-time, ensuring you are always up-to-date with its market dynamics.
Now, let’s once again focus on the performance of the investment portfolio and clarify the optimization plan:
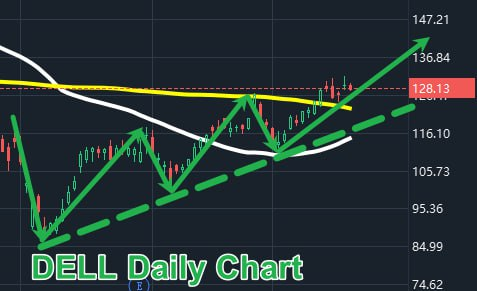
DELL’s overall trend is performing well, with the price steadily moving along the trendline. Each time the price pulls back near the trendline, it forms a strong support platform and quickly rebounds. Currently, the price is above the yellow trendline, indicating a healthy trend. Moving forward, we will focus on the relationship between the price and the yellow trendline. As long as the price remains firmly above the yellow trendline, we will choose to continue holding, patiently awaiting further profit returns.
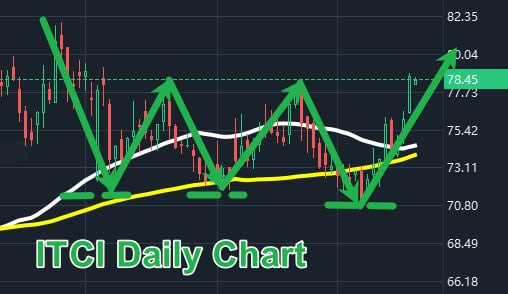
ITCI’s overall trend is centered around the yellow and white trendlines. Although the price has experienced significant volatility during its movement, this has not affected its upward potential. After three bottoms, ITCI successfully broke through the yellow and white trendlines, showing a very strong rebound momentum, bringing a 1.62% profit return to our community members. Currently, the overall direction is showing a consolidating pattern, so we choose to continue holding and wait for potential profit returns.
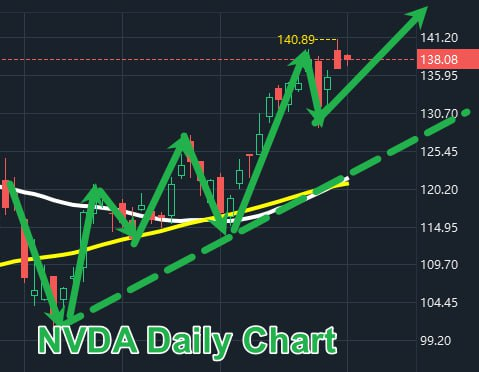
NVDA is currently continuing its strong rebound momentum, with the overall trend performing very well. Each time the price pulls back, it stabilizes quickly and embarks on a strong rebound. Recently, NVDA’s price has risen, bringing a maximum profit return of 11.11% to our community members. Based on a strategy of securing steady profits, we have taken partial profits at the high, locking in some gains early. Moving forward, we will patiently wait for NVDA to pull back to a key support level before gradually re-entering the market to capture more profit opportunities.
Ladies and Gentlemen, the powerful portfolio of high quality stocks carefully screened by the New World Quantitative Investment Decision System has already brought great profits to our community. I am sure you have all experienced the extraordinary profitability and appeal of the New World Quantitative Investment Decision System.
Our portfolio of stocks is constantly changing, not just in numbers, but in the steady growth of the wealth of all our friends in the community. Each gain is a testament to our joint efforts and brings us one step closer to the goal of wealth freedom.
If you’re uncertain about the future trends of the stocks in your portfolio, please be sure to send your stock holdings information to the assistant. She will use the powerful trend prediction and analysis capabilities of the New World Quantitative Investment Decision System to provide you with the most objective analysis and tailor the most professional, personalized trading strategy for you.
All of this will help you achieve steady wealth growth quickly, seize opportunities, and get ahead of others.
Ladies and gentlemen, the New World Quantitative Investment Decision System has become a guiding light for our community, constantly illuminating our investment journey. Especially now, after further improvements and upgrades, the New World Quantitative Investment Decision System possesses even more powerful trend prediction capabilities and outstanding evaluation functions, filling us with confidence and anticipation for reaching financial freedom sooner.
Even more exciting is that the success rate of the New World Quantitative Investment Decision System has reached an astounding 95%! This is not just a numerical increase but the result of countless days and nights of dedication and effort from the research and top analyst teams. Now, the system has taken on a life of its own, continuously evolving and improving every day.
Through the first internal test trading of the New World Quantitative Investment Decision System, we successfully collected 200,000 pieces of valid trading data. With this valuable data, my R&D team worked overtime to complete the refinement and upgrade of the New World Quantitative Investment Decision System, and now its investment ratings have been greatly improved.
As a result, the New World Quantitative Investment Decision System is able to provide you with accurate solutions to any questions you may have on your investment journey. By owning it, you are embracing wealth and all opportunities.
After this upgrade, New World Quantitative will be more worthy of our attention and expectation. We can foresee that the next internal test transaction will be more successful than the first internal test, and bring you more lucrative returns!
The second internal test of the New World Quantitative Investment Decision System will officially begin at 4:30 PM Eastern Time on October 22nd (next Tuesday). We can foresee that this internal test trade will be even more successful than the first, bringing even greater returns.
However, this is not just a simple event launch; it is also an excellent opportunity for community members to apply the knowledge they’ve learned to real-world trading. Through this test, everyone will be able to quickly enhance their personal practical trading abilities. I believe that in the near future, you too will join the ranks of experts in the investment world.
Therefore, I encourage all community members to actively contact my assistant to register for this internal test. Due to limited spots, we will prioritize early registrants. Additionally, because the effective trading data collected during the internal test cannot be duplicated, those who successfully participated in the first internal test will not be eligible to receive the 500 USDT trial funds for the second test.
If you are still looking forward to generating more profit by following the trading signals from the New World Quantitative Investment Decision System, you can choose to use a small amount of your own funds to participate in the second internal test. From the perspective of stable profits and risk management, I recommend starting with an investment of $5,000 to $10,000, following the trading signals issued by the New World Quantitative Investment Decision System. This approach not only helps you steadily accumulate wealth but also allows you to validate the knowledge you’ve learned through real-world trading. I believe your practical trading skills will improve quickly. Let’s work together to seize this rare opportunity and move toward the peak of wealth!
Today’s wealth opportunity has come to a successful conclusion, but we are about to have an exciting sharing of the core workings of the New World Quantitative Investment Decision System. We look forward to everyone in the community actively participating in the discussion later and continuing to improve their real-world trading skills. See you later.
Today’s Q&A:
1.What are the powerful features of the New World Quantitative Investment Decision System? (20 points)
2.When is the second internal test of the New World Quantitative investment decision-making system scheduled? (20 points)
Closing commentary:
Ladies and gentlemen, we have witnessed the power of portfolio profitability and once again experienced the ease of making money with the New World Quantitative Investment Decision System.
Today, we have not only optimized our investment portfolios, but also participated in the exciting lucky draw, received more NWC tokens, and felt the joy of these potential value-added wealth.
Let’s start today’s wealth learning journey with hope and expectation, and continue to walk hand in hand on the path of sound investment.
1. What is the trajectory of the three major stock indices and what signals are they sending?
2. The strong profitability of the investment portfolio is once again reflected, where is the direction of our optimization?
3. The core working principle of the New World Quantitative Investment Decision System – the horizontal breakout buying method.
I will share the content of the above topics.
Let’s focus on the trajectory of the three major indices to clarify the current mainstream environment of the investment market.
The Dow Jones Industrial Average continues to hover near historical highs, with overall performance characterized by consolidation. Although there have been price fluctuations, the overall trend remains intact, signaling a stable market rebound.
The Nasdaq and S&P 500 are also experiencing high-level consolidation. While the trends are positive, they currently lack strong upward momentum for a breakout. As a result, today’s market performance reflects a divergence among the corresponding sectors.
Overall, the recent direction of the stock indices remains stable, but the divergence among individual stocks is becoming more pronounced. This means we need to make timely optimizations and adjustments to our investment portfolio to ensure it maintains stable profitability in this market environment.
Now, let’s once again focus on the trajectory of the investment portfolio and clarify the next steps in our strategy.
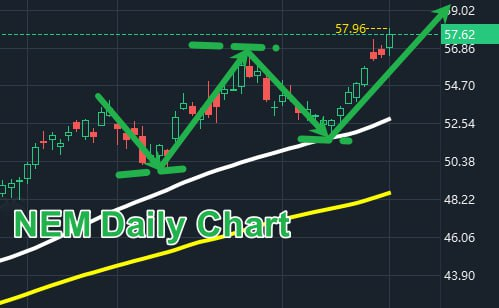
NEM, a high-quality stock in the gold sector, has once again demonstrated a strong bullish rebound today, delivering a 10.81% profit return to our community members. Congratulations to all the friends who built positions in NEM with us!
Recently, NEM’s performance has been outstanding, with the price forming strong support and rebounds every time it pulls back near the trendline. The past two days have been particularly impressive, not only with a one-sided rebound after pulling back to the trendline, but also with the exciting breakthrough of the “W” neckline, continuing to push toward higher levels. We are full of confidence and anticipation for the further profit returns that NEM will bring.
Continue to monitor NEM’s performance and look forward to more wealth opportunities.
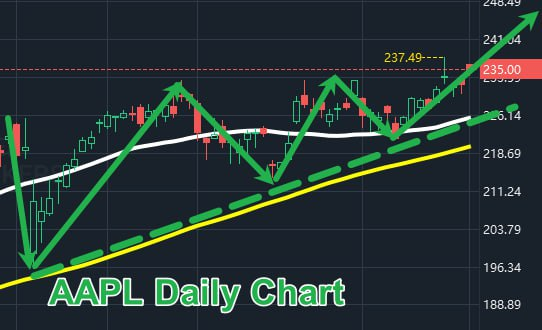
AAPL is currently operating within an upward channel, with the price stabilizing and rebounding each time it pulls back to the lower edge of the channel, forming a very strong rebound trend. This time, after pulling back near the trendline, it once again stabilized and rebounded, successfully holding above the white trendline, further strengthening the upward trend. Therefore, we choose to continue holding AAPL, patiently waiting and anticipating even greater profit returns.
We believe that as the trend continues to develop, AAPL will bring us even more wealth opportunities.
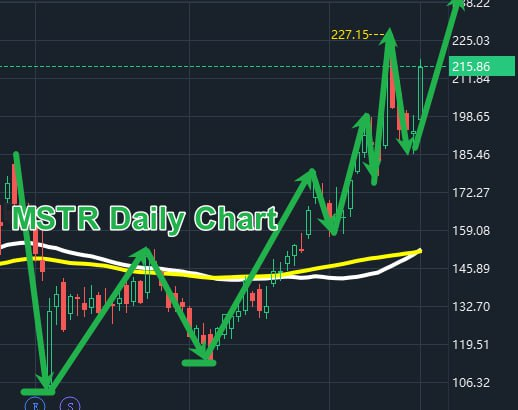
MSTR, as a Bitcoin-related stock, has shown an impressive performance recently. After forming a “W” double-bottom pattern at the low, the price quickly broke through the “W” neckline, displaying a classic consolidation and rebound trend, painting a picture of steady wealth growth for us.
Currently, MSTR has delivered a 29.26% profit return for our community members. Congratulations once again to everyone who steadfastly synchronized their positions with us. MSTR’s rebound not only reflects its own strength but also serves as a signal for the broader cryptocurrency market—indicating a rebound in BTC. Bitcoin is also in a recovery trend, further confirming the positive outlook for the cryptocurrency market.
We believe the upcoming trend will bring us even more wealth opportunities.
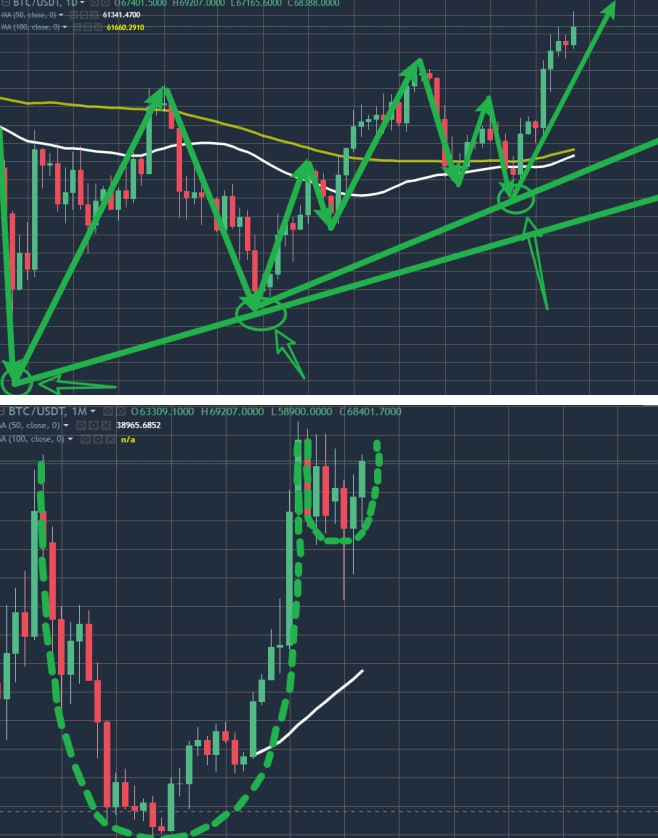
The chart’s trajectory clearly shows that the BTC daily chart is currently in a steady upward movement, challenging the resistance level above. This indicates a gradual improvement in market sentiment and strengthening bullish momentum.
What’s even more noteworthy is that the BTC monthly chart has formed a very standard rounded bottom pattern, and is currently building a “cup and handle” formation. Once this pattern is completed, we have every reason to believe that a new one-sided trending market opportunity will quietly emerge. This means that the opportunity for our community members to achieve steady wealth growth is within reach, and the upcoming market is something we can eagerly anticipate.
I believe the strategic conditions for achieving steady wealth growth are now very sufficient, as reflected in the following key aspects:
1.The start of the Federal Reserve’s rate-cutting cycle: This policy has injected new vitality into the global investment market, greatly boosting the release of market optimism and supporting the rise of various asset classes.
2.The upcoming presidential election: Both candidates, Trump and Harris, have shown a favorable attitude toward the cryptocurrency market. Additionally, historical data indicates that in the year following each presidential election, the cryptocurrency market often experiences an exciting “bull market.” While history may not repeat itself exactly, it often rhymes, giving us reason to be optimistic.
3.The cryptocurrency market’s key indicator—BTC: Analysis of both the daily and monthly charts shows that BTC is currently demonstrating a steady rebound trend with strong upward potential, providing solid support for the entire cryptocurrency market.
4.The improvement and upgrade of the New World Quantitative Investment Decision System: Thanks to the continued efforts of our development team, the current New World Quantitative Investment Decision System now boasts more powerful trend forecasting and rating capabilities. Excitingly, its success rate has increased to 95%. This upgrade will not only provide more accurate and stable trading signals for the upcoming second internal test, but will also help our community members accelerate their wealth accumulation, turning the dream of financial freedom into reality.
Dear friends, it is precisely because of these four strong strategic conditions that we are filled with even more confidence and anticipation for the second internal test of the New World Quantitative Investment Decision System, which will officially begin on October 22 (next Tuesday) at 4:30 PM Eastern Time.
We can already foresee that all participants in this internal test will not only reap greater profit returns but also further validate and improve their trading skills through real-world experience. This is not just about wealth growth; it is also the perfect opportunity to enhance your practical trading abilities.
Therefore, I encourage all members of the community to actively participate in this internal test. Follow the stable trading signals from the New World Quantitative Investment Decision System and adopt high-success, low-risk trading strategies to steadily grow your wealth. The opportunity is right in front of you, and taking action is the first step toward success.
In this process, everyone can not only achieve considerable profit returns but also help our New World Asset Management development team collect more new and valuable trading data. This will provide strong support for the further enhancement and upgrade of the New World Quantitative Investment Decision System.
However, the second internal test is limited to only 1,000 spots, and availability is very limited. Since we need to collect more new trading data, those who have already successfully participated in the first internal test have had their trading data stored in the database. Collecting duplicate data does not contribute to the system’s upgrade and optimization. Therefore, in this test, participants from the first test will not be eligible to receive the 500 USDT trial funds again.
If you still wish to follow the stable trading signals provided by the New World Quantitative Investment Decision System and achieve steady wealth growth, you can voluntarily use a small amount of funds to participate in this trade.
In the beginning, I recommend using between $5,000 to $10,000 to follow the stable trading signals provided by the New World Quantitative Investment Decision System. This way, you can not only secure substantial profits but also effectively manage potential risks, ensuring steady wealth accumulation.
Ladies and gentlemen, our community is about to embrace the historic opportunity of the second internal test of the New World Quantitative Investment Decision System. I am confident that those who successfully participate in this test will not only achieve considerable profit returns but will also significantly improve their practical trading skills.
This enhancement and upgrade will equip the New World Quantitative Investment Decision System with robust trend forecasting and analysis rating capabilities, bringing its success rate closer to perfection. I believe that all metrics of the New World Quantitative Investment Decision System will meet the standards required for a successful launch. This is the historic moment we have all been eagerly awaiting, and it will take our collective effort to make it a reality.
Today’s wealth opportunity sharing has successfully concluded, but our pursuit of financial knowledge and our determination to enhance practical trading skills remain unwavering.
Now, let’s begin today’s learning journey. Today, we will focus on sharing the core principles of the New World Quantitative Investment Decision System—specifically, the breakout buy-in method during consolidation. I hope that through this session, everyone will gain a deeper understanding of how the system operates, providing stronger support for our investment decisions.
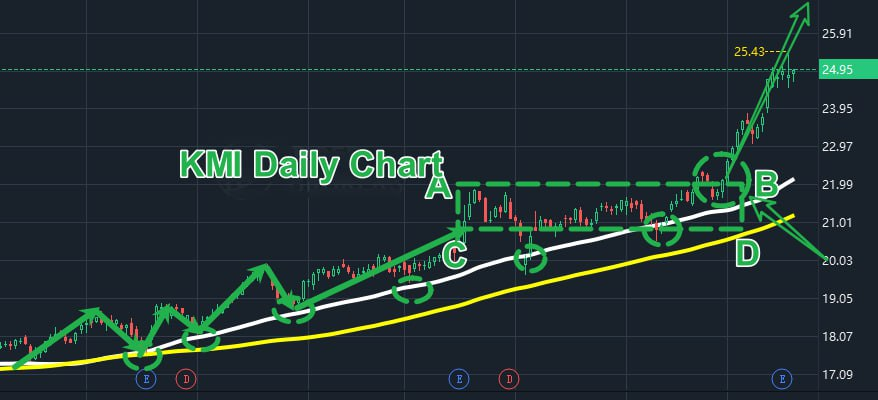
As shown in the chart: a comparison of KMI’s daily trend chart is shared.
A horizontal breakout refers to when market prices move sideways for a period, forming a relatively flat price range. When the price breaks through the upper or lower boundary of this range, it creates a “horizontal breakout.” This phenomenon is typically seen as a signal that a new trend is about to emerge.
A horizontal breakout consists of three stages:
1.Horizontal phase: This usually occurs after a period of trending movement (upward or downward), where the market enters a consolidation period. During this phase, the forces of buyers and sellers are relatively balanced, with limited price fluctuations forming a narrow range.
2.Breakout opportunity: When the asset price oscillates within a range for an extended period, building up enough momentum, a strong breakout typically occurs. The breakout can either be upward or downward.
2.1 Upward breakout: This typically occurs when bullish sentiment gradually strengthens, with buying power outweighing selling pressure, pushing the price above the upper resistance level.
2.2 Downward breakout: This happens when selling pressure dominates, causing the price to break below the lower support level.
3.Confirmation of the breakout:
To avoid false breakouts, we typically look for the following signals:
3.1 Closing price: The closing price breaks through the resistance or support range, further confirming the validity of the breakout.
3.2 Retest of support/resistance: After the breakout, the price retests the previous resistance level (for an upward breakout) or support level (for a downward breakout). If the trend continues after the retest, it confirms the reliability of the breakout.
As shown in the daily chart of KMI, points A, B, C, and D form a rectangular consolidation pattern. Once the price has accumulated enough strength and breaks above the rectangular resistance level at point B, and the breakout is confirmed, a new upward trend is expected to gradually unfold.
Moreover, the daily chart of KMI looks very impressive. Each time the price pulls back to the vicinity of the white trend line, a very clear stabilization and rebound trend forms.
Ladies and gentlemen, I believe you have now mastered the core principle of the New World Quantitative Investment Decision System— the rectangle range breakout buy strategy. Now, I encourage you to actively apply this knowledge in real trading. Not only will this help improve your practical trading skills, but it will also bring you more profit opportunities.
The New World Quantitative Investment Decision System’s second internal test trading offers everyone an excellent opportunity to apply their knowledge in real trading. Therefore, I encourage all members of the community to actively prioritize this internal test. Please follow the stable trading signals issued by the New World Quantitative Investment Decision System, seize this wealth-building opportunity, and take a step closer to achieving financial freedom.
A busy week has come to an end, and a wonderful weekend is just around the corner. At this exciting time, you can gather with family and friends to enjoy the beauty and joy that life brings. Let’s relax, cherish every moment spent with loved ones, and make the most of this special time. Wishing everyone a happy weekend!