Morning review:
Ladies and gentlemen, today we will analyze the specific impact of the second quarter GDP and initial jobless claims on the stock market, and explore in depth how these economic data affect the flow of funds and the trajectory of market operation. By interpreting these key economic indicators, we can more accurately build and optimize our investment portfolio and ensure that our wealth growth path is more stable
The final annualized quarterly rate of the second-quarter GDP is an extremely important economic indicator. It represents the GDP data for a specific quarter after final revisions, expressed on an annualized basis. This data not only reflects the overall performance of the economy during that quarter but also allows for comparison with the previous quarter, helping us to deeply understand the speed and trend of economic growth
Weekly initial jobless claims refer to the number of individuals who apply for unemployment benefits for the first time during a specific week. This is an important economic indicator used to measure the health of the labor market
The final annualized rate of actual GDP for the second quarter, released today, remained at 3%, in line with market expectations, demonstrating the economy’s robustness. Meanwhile, the weekly initial jobless claims for the week ending September 21 fell to 218,000, the lowest in nearly four months, below the market expectation of 225,000, indicating the strength and resilience of the labor market. These positive data points send a clear positive signal to the stock market, boosting confidence in the economy’s steady progress and are expected to provide short-term support to the market, increasing optimism. Therefore, we should continue to closely monitor market dynamics, seize investment opportunities, and optimize our portfolios to adapt to potential market changes
The impact of PCE data on the current stock market is crucial. We need to focus not only on the main market trends but also on continuously optimizing our portfolios. This approach allows us to pursue wealth growth while enhancing the defensive strength of our portfolios, ensuring that we can strike when opportunities arise and protect our gains in a volatile investment environment, achieving steady profits. I look forward to exploring new insights and strategies with everyone today as we move forward together
PCE data, or Personal Consumption Expenditures data, reflects changes in personal spending on goods and services and is an important tool for measuring changes in the prices of goods and services purchased by consumers. As one of the key indicators for assessing inflation, PCE data has a significant impact on understanding economic conditions and monetary policy decisions. By analyzing PCE data, we can gain a deeper understanding of inflation trends, allowing us to make wiser adjustments to our investment portfolios and ensure that asset allocations are adapted to changes in the economic environment
Today’s data shows that the annual rate of the core PCE price index for August was 2.7%, reaching a new high since April and meeting market expectations; whereas the monthly rate of the core PCE price index was only 0.1%, a new low since May and below the expected 0.20%
This reflects rising market expectations for further interest rate cuts by the Federal Reserve. The lower-than-expected monthly rate indicates that inflationary pressures are easing, which provides more policy room for the Federal Reserve and may make further easing of monetary policy a reality. For the stock market, this is undoubtedly a positive signal, especially for sectors sensitive to interest rates, such as technology stocks and growth stocks, which may see stronger rebound momentum
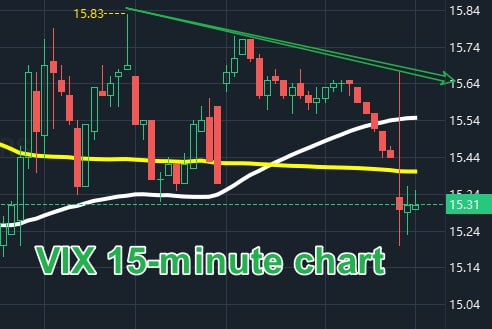
The VIX trend chart is negatively correlated with stock indices.
The 15-minute VIX chart shows an overall weak oscillation pattern, indicating that current investor sentiment is relatively stable. This stability in sentiment is beneficial for the stock index’s performance today and aids in its rebound.
Therefore, in our current operations, we should continue to focus on the main direction of the market and keep optimizing our investment portfolio to achieve stable profit targets. The stability of market sentiment provides us with a favorable trading environment
ladies and gentlemen, in the world of investing, understanding and seizing wealth opportunities is very important. We should focus on the main trend direction of the market, and when the major trend remains unchanged, even if there is a short-term pullback in market prices, this is not a time to worry, but rather an excellent moment to grasp opportunities again. We should use such market adjustments to optimize our investment portfolio, preparing to obtain better returns when the market recovers. This is the wisdom of investing—be greedy when others are fearful, and fearful when others are greedy
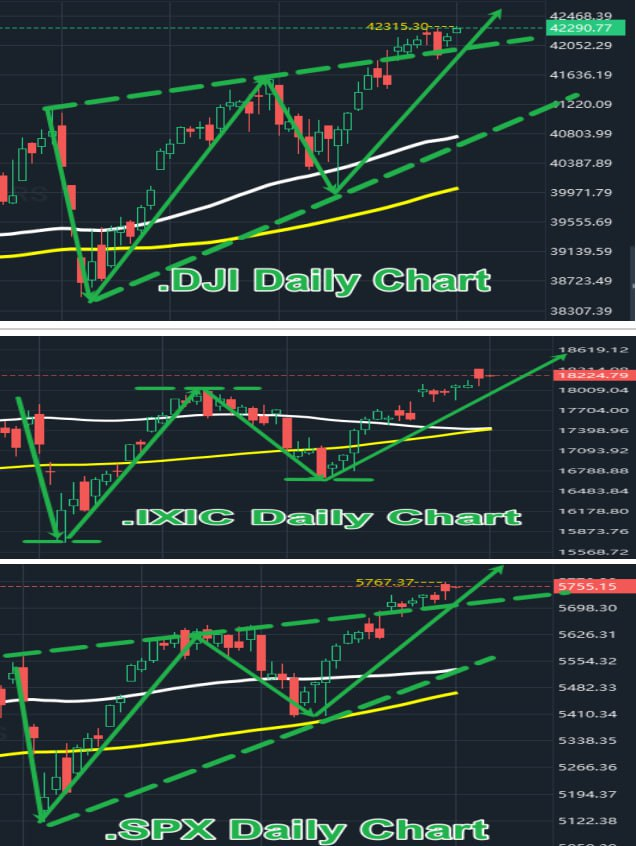
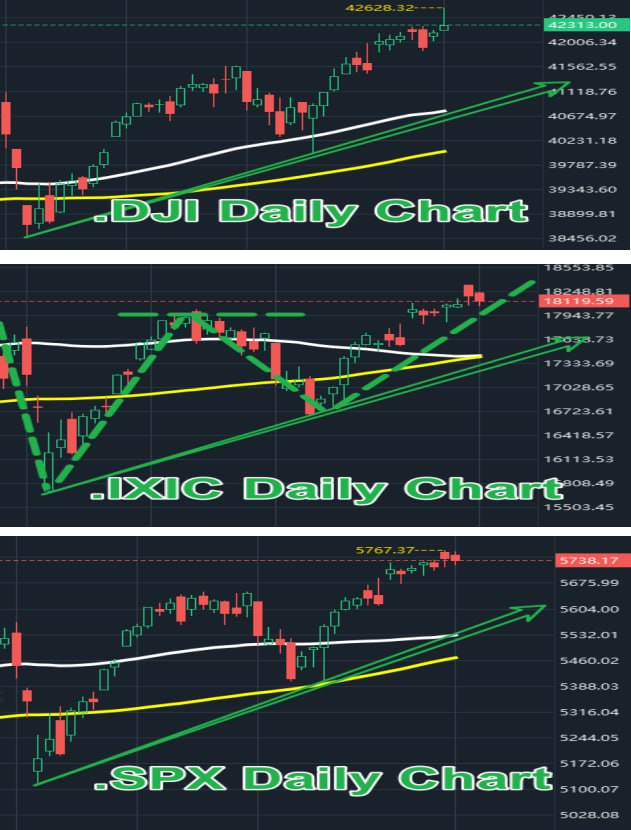
Let’s now focus on the performance of the three major stock indices: The Dow Jones Industrial Average has reached a new historical high again, signaling a continued upward trend; the S&P 500, although hovering near historical highs, has not made new highs but still shows a relatively small degree of pullback, and the overall trend remains unchanged; the Nasdaq Composite is lingering near the “W” pattern’s neckline, a crucial time to verify the effectiveness of the neckline breakout
Combining this information, we can clearly see that although the three major stock indices are currently in a state of fluctuation, the overall trend direction has not changed and continues to show a rebound pattern. This indicates that the current investment environment is healthy and suitable for us to continue seeking new wealth opportunities to include in our investment portfolio. At the same time, we should also continue to optimize our investment portfolio to ensure that it remains highly profitable
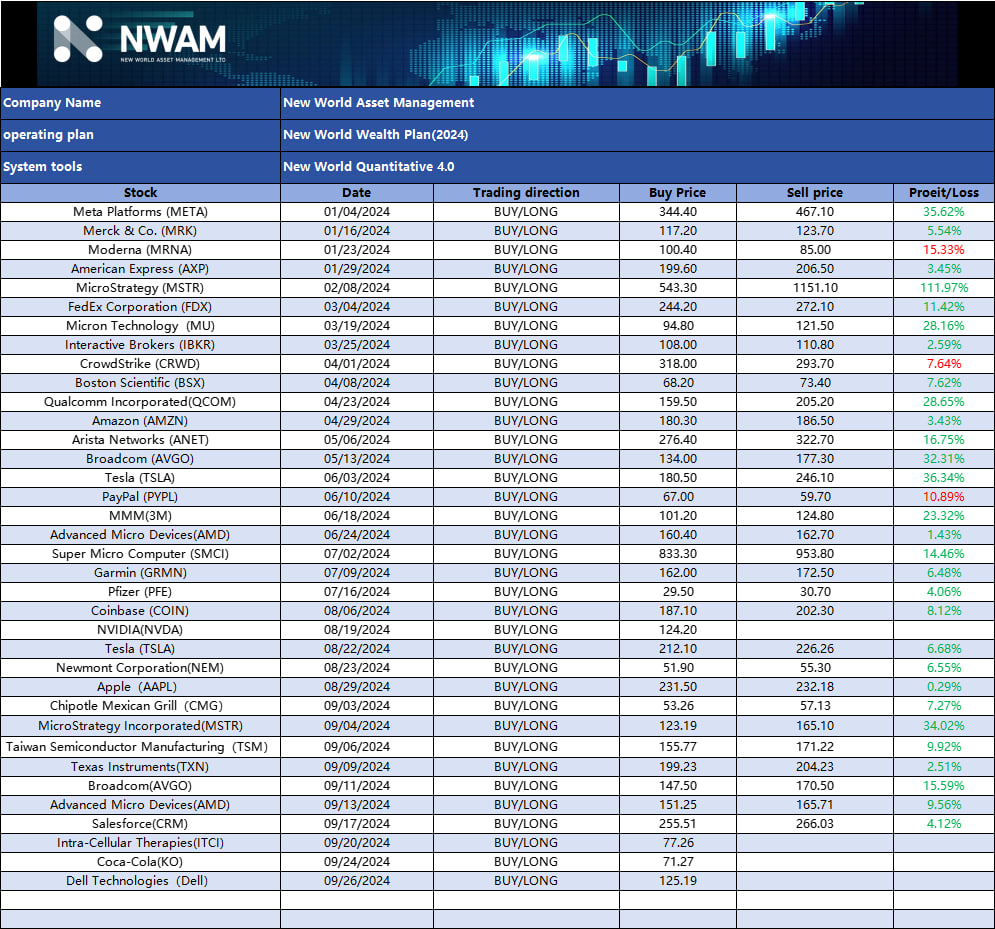
Now let’s focus on the performance of stocks in our investment portfolio and further explore the trajectory of wealth.
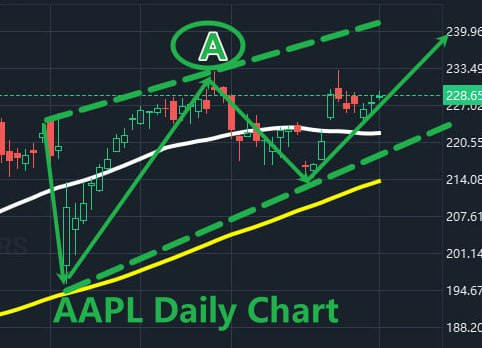
AAPL currently maintains a healthy and robust trend direction, with its price now stable above the white trend line, gearing up to challenge the position at point A. A successful breakthrough would signify the formation of a new unilateral trend, which could bring us considerable profit returns.
From the overall trend direction, we choose to continue holding AAPL, believing that it can bring us a broader range of profit returns
ladies and gentlemen, today’s release of the PCE data has had a positive impact on the investment market. Therefore, in the face of short-term pullbacks in certain stocks on the market, we should not feel worried but instead see this as an excellent opportunity to proactively build positions. After rigorous screening, we have now identified opportunities for quality stocks to build positions today. I hope those interested in participating will immediately contact my assistant to receive the relevant information and seize this wealth opportunity. Assistant contact
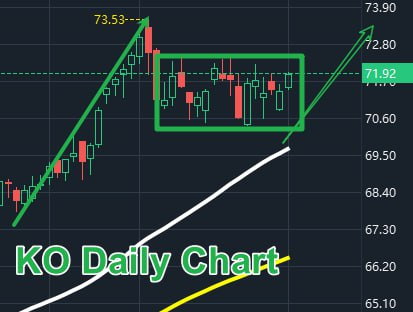
Let’s continue to focus on the performance of stocks in our investment portfolio: KO currently maintains its overall trend direction above the yellow and white trend lines, with its major trend direction unchanged, continuing to show a rebound trend. At present, it is in a fluctuating pattern, and once it successfully breaks through the upper edge of the fluctuation platform, forming a “flag consolidation” pattern, this usually indicates that a new round of unilateral trend movement is about to unfold, offering us more opportunities to make money. Therefore, we choose to continue holding and waiting
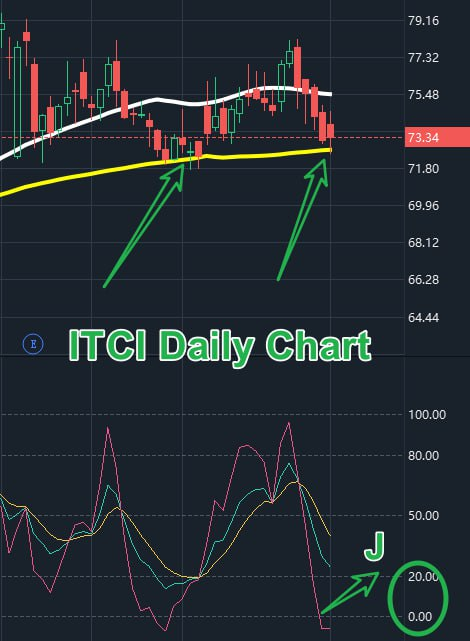
ITCI is currently at a critical point for directional choices, hovering near the yellow trend line. If the stock price can stabilize and firmly hold above the yellow trend line, it often signifies that an opportunity to re-enter has arrived. Additionally, from a technical analysis perspective, the J value of the KDJ indicator is approaching the zero axis, indicating that the stock has entered an oversold state, which suggests there may be a chance for a price rebound in the short term. Therefore, we choose to continue holding ITCI, patiently waiting for its subsequent market performance to further explore its trend trajectory
Dear friends, for the stocks in our investment portfolio, we will continue to monitor and track their real-time dynamics to ensure that we can formulate targeted trading strategies at any time.
As for optimizing the investment portfolio, since not every community member holds the same stocks and everyone has different trading styles, the methods and final results of optimizing investment portfolios will naturally vary. We encourage each member to make reasonable adjustments to their investment portfolios according to their specific circumstances, to adapt to market changes, and to achieve steady growth in personal wealth
Our main methods for optimizing investment strategies are as follows:
1.Use a combination of medium and short-term approaches: Reduce holdings in profitable stocks to lock in some of the profits already gained. When a stock pulls back to a key support line and stabilizes for a rebound, restore the reduced positions
2.Sell all profitable stocks: Continuously seek new wealth opportunities and promptly incorporate them into the investment portfolio
3.Timely selling strategy: If the trend of an individual stock undergoes unfavorable changes, it should be sold promptly to reduce potential risks
- Flexible buy low, sell high strategy: For stocks whose trends have changed, one can choose to reduce some positions and then reposition when the stock pulls back to a key support level, making trades back and forth. This strategy demands a higher level of trading ability and system construction
If members of our community individually optimize your own investment portfolios, because each person’s trading strategy and risk tolerance vary, your operating style will be a key guiding factor when making adjustments to your portfolio.
If you are an investor who prefers short-term trading, you might be more suited to a strategy of quick entry and exit, focusing on profit opportunities brought by short-term market fluctuations. Conversely, if you are a long-term investor, you might prefer to hold stocks with strong fundamentals, seeking long-term stable growth
Therefore, it is recommended that every member of our community choose an investment strategy that suits your own trading style
When facing stock market fluctuations, determining what type of trader you are is a crucial step.
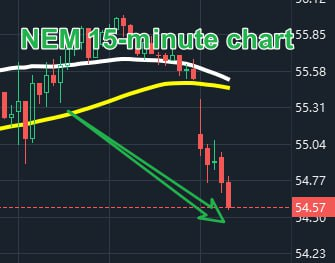
As shown in the chart: NEM has broken below the yellow trend line in the 15-minute chart, indicating a short-term trend entering a correction phase. What is your first reaction to this situation?
If you choose to sell immediately because you’re concerned that NEM might continue to decline in the short term, this indicates you lean towards short-term trading. Short-term traders are usually sensitive to rapid market changes, preferring to quickly lock in profits or reduce losses. Their trading strategy primarily involves capitalizing on short-term market fluctuations for quick gains
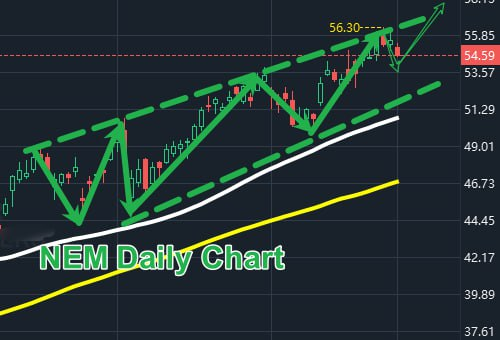
If, upon seeing the price pullback in the 15-minute chart, you do not panic over short-term fluctuations but instead judge from the daily chart’s larger trend that NEM is still in an upward channel and remains above the yellow and white trend lines, this indicates that you are a long-term investor.
Long-term investors focus more on a company’s fundamentals and long-term growth potential, and they do not change their investment decisions easily due to short-term market fluctuations. This investment style is suitable for those seeking long-term value growth and stable returns
Therefore, understanding your own investment style is crucial for developing effective trading strategies and optimizing your investment portfolio. I encourage each of you to deeply consider your style preferences: Are you a short-term trader or a long-term investor? This will help you make wiser decisions in your investment journey
Moreover, in the upcoming “10th New World Quantitative 4.0 Investment Decision System Financial Training Program” that New World Asset Management is preparing, we will leverage the “Expert and Investment Advisory System” within New World Quantitative 4.0. This system will tailor specific trading strategies based on each community member’s unique trading style, helping all our friends in the community on their path to financial freedom
With more and more new friends joining our New World Asset Management community and the enthusiastic return of participants from previous sessions, the upcoming “10th New World Quantitative 4.0 Investment Decision System Financial Training Program” carries even deeper significance. This is not just an ordinary training course but a crucial milestone that embodies our hopes and mission for the successful launch of the New World Quantitative 4.0 Investment Decision System as soon as possible
In this training course, we will dive deep into the core technologies and operating strategies of the New World Quantitative 4.0 system, helping every community member to better grasp market dynamics and optimize their investment decisions. I hope that each of you can use this learning opportunity to not only enhance your personal investment skills but also contribute to the refinement and promotion of the New World Quantitative 4.0 Investment Decision System. Let’s work together to witness the growth and success of New World Quantitative 4.0!
Dear friends, although this morning’s sharing session has concluded, our journey of learning is just about to set sail. Let’s move forward with even greater enthusiasm to embrace the ocean of knowledge that belongs to us all.
Later, I will continue to share with you the “specific usage and application of the KDJ indicator in the investment market.” I look forward to meeting you again in the ocean of knowledge. See you later.
Today’s morning quiz:
1.What is the important role of PCE data? (20 points)
2.What are the criteria for determining short-term and long-term trading styles? What is your trading style? (20 points)
Closing commentary:
Ladies and gentlemen,
I’m delighted to be here with you today in our community as we explore the changes in the Consumer Confidence Index and its impact on the stock market. We will closely monitor the main market trends and build the most defensive investment portfolios to ensure steady wealth growth in a constantly changing market environment. I hope everyone will actively participate as we witness each step of growth and success together.
Beautiful moments always arrive as expected, and I believe many of you have participated in this afternoon’s raffle and won your desired prizes. For those of you who did, I extend my heartfelt congratulations—your efforts throughout the week have been richly rewarded. For those who haven’t participated yet, if your raffle points have reached 100, I encourage you to join today’s draw and go for the prize you’re after.
As we celebrate the joy of winning, let’s not forget our commitment to learning. Let’s begin this afternoon’s learning journey with excitement and positivity!
The Consumer Confidence Index is a measure of consumers’ overall confidence, sentiment, and optimism about their financial situation and the overall economy
Today, the final September Consumer Confidence Index from the University of Michigan rose to 70.1, slightly up from the preliminary value of 69 and significantly higher than August’s 67.9, reaching the highest point in the past five months. This result indicates that consumers have increased confidence in their financial situation and the overall economy. This rise in optimism undoubtedly has a positive impact on the stock market
Let’s focus on the latest dynamics of the three major stock indices: The Dow Jones Industrial Average has reached a new historical high again. Despite some pullback after initial gains, the signals of continued upward movement and rebound confidence remain strong; the Nasdaq Composite faced resistance near yesterday’s high and did not achieve the expected strong breakthrough, but it is stably operating near the “W” neckline, indicating its trend’s solidity; and while the S&P 500 has slightly pulled back near its historical highs, its overall trend direction remains unchanged.
Combining the information above, it’s clear that the current investment environment is stable. Although there are fluctuations in stock prices, the overall trend is still moving in a positive direction. These fluctuations are not sufficient to impact our determination to continuously optimize our investment portfolios and enhance profitability. Please stay alert, actively adjust and optimize your investment strategies, and seize the long-term growth opportunities the market offers
In the market, opportunities are often created when stock prices pull back and people feel panic, while risks accumulate as prices rise. Therefore, the more the market fluctuates and stock prices retreat, the more carefully we should evaluate and seize the timing to enter the market. This is precisely the moment when we, as investors, can demonstrate our decisiveness and insight
Recently, our New World Asset Management has utilized the powerful trend prediction and analysis capabilities of the New World Quantitative 4.0 investment decision system to build the most robust investment portfolio defenses for all our community members. This not only helped everyone achieve steady wealth growth but also ensured that each member’s investment actions are strategically positioned to advance or retreat as needed. Through such strategies, we can actively seek profit opportunities while effectively guarding against potential risks in the face of market uncertainties, ensuring the safety and appreciation of each community member’s assets
In our investment portfolio, we have carefully selected stocks from the technology sector, gold sector, and cryptocurrency concepts as our main focus, supplemented by the consumer sector for stable support. This combination is designed to ensure that while we pursue high returns, we can also effectively withstand the risks brought about by market fluctuations. The technology sector and cryptocurrency concept stocks provide us with aggressive growth opportunities, while the gold and consumer sectors act as our defensive shields, protecting our assets to ensure steady growth in various market conditions
The content above summarizes our investment portfolio composed of premium stocks selected by the New World Quantitative 4.0 investment decision system. I believe everyone has deeply felt the powerful capabilities of the New World Quantitative 4.0 system. It utilizes its robust big data analysis ability not only to filter the most valuable market information for our investment decisions but also to accurately identify investment opportunities across various sectors, providing solid data support for our decisions
More importantly, the “Expert and Investment Advisor System” within the New World Quantitative 4.0 investment decision system can tailor exclusive operational strategies based on this market information and each person’s trading style. Whether you prefer short-term trading or long-term investing, this system can provide the most suitable strategy for you, ensuring a smoother path on your investment journey and personalized wealth growth. This is the charm of the New World Quantitative 4.0 system. It’s not just an investment analysis tool; it’s a guide leading every member of our community to successful shores
So I encourage all members of our community to actively participate in the upcoming “10th edition New World Quantitative 4.0 Investment Decision System Financial Training Class.” In this training session, I will focus on explaining in depth the core working principles and methods of using the New World Quantitative 4.0 investment decision system. This training is intended to ensure that every participant can fully master the operation of the New World Quantitative 4.0 system, thereby applying it more effectively in real investment scenarios, optimizing their individual investment portfolios, and achieving wealth growth
To ensure that everyone can participate, we are actively preparing and expect to officially start the course next week. Therefore, I encourage all community members to actively participate, contact the assistant in advance to reserve your spot in the course, and make sure you don’t miss this learning opportunity
Moreover, the investment trend analysis methods and trading strategies I share daily in the community, including various market conditions (such as upward trends, downward trends, and oscillating trends) and patterns (like “W” shapes, head and shoulders tops and bottoms, rounded tops and bottoms, converging triangles, rectangles, and trend channels), along with the application principles and methods of core technical indicators like MACD and KDJ, have been systematically integrated into our New World Quantitative 4.0 investment decision system
Through daily community shares, everyone can gradually understand and learn the workings and methods of using the New World Quantitative 4.0 system. For more in-depth content, I will focus on sharing with you all during next week’s “10th edition of the New World Quantitative 4.0 Investment Decision System Financial Training Class.” I hope every member will actively participate, so we can collectively enhance our investment decision-making skills
Ladies and gentlemen., let’s continue our learning journey today—delving deeper into the application of the KDJ indicator in stock market trends.
Yesterday, we focused on sharing the basic principles and components of the KDJ indicator:
The KDJ indicator determines the market’s overbought or oversold conditions by calculating the range of price fluctuations. It consists of three lines: the K value (fast line), the D value (slow line), and the J value (considered an extreme signal of overbought or oversold conditions)
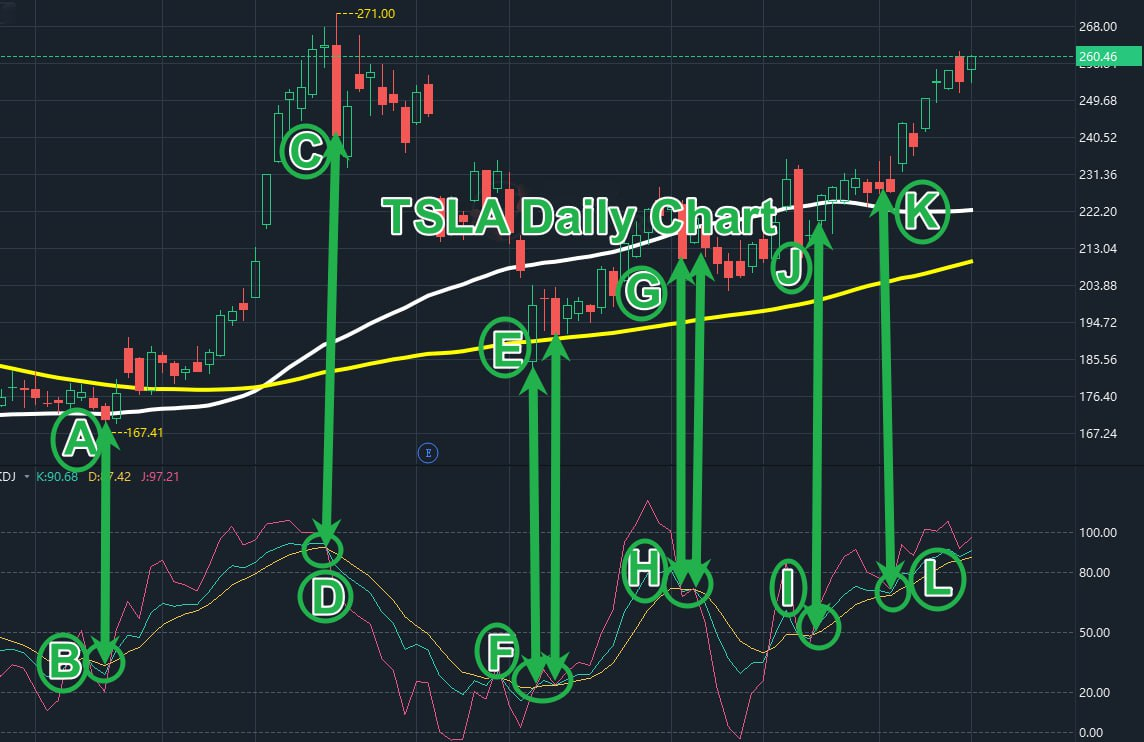
Now let’s focus on the KDJ indicator to understand its specific buying and selling methods, finding more accurate signals for our trades. As shown, in the TSLA daily chart, we can clearly derive the following information from the chart’s performance:
1.Buy and Sell Signals
When the K value crosses above the D value, it creates a golden cross, suggesting that the market’s upward trend may continue, which is a signal to buy.
When the K value crosses below the D value, it creates a death cross, suggesting that the market’s downward trend may persist, which is a signal to sell
2.Overbought and Oversold Determination
When the K value, D value, and J value are all above 80, it indicates that the market has entered an overbought state and there is a possibility that prices may peak and fall back, making it appropriate to consider selling high or waiting.
When the K value, D value, and J value are all below 20, it indicates that the market has entered an oversold state and there is a possibility that prices may have bottomed out, which could be a buying opportunity
3.Short-Term Trend Determination
Because the KDJ indicator is very sensitive to market changes, it is suitable for determining short-term trends. For day traders and high-frequency traders, this indicator provides timely signals for entering and exiting the market
Ladies and gentlemen., over the past couple of days, we have focused on the workings of the KDJ indicator. It determines the market’s overbought or oversold conditions based on the range of price fluctuations and uses the interactions of the K, D, and J values to signal when to buy or sell. The key lies in identifying overbought and oversold states and using the crossover points of the K and D values to indicate the timing for buying or selling
Additionally, the methods of using the KDJ indicator and its techniques for judging overbought and oversold conditions have been successfully integrated into our New World Quantitative 4.0 investment decision system, making this tool even more powerful and practical. Through today’s sharing, I believe every member of our community has gained a deep understanding of how to utilize the KDJ indicator
Starting next week, I will focus on sharing the core working principles and usage methods of the New World Quantitative 4.0 investment decision system with everyone. I hope every community member will actively participate in learning, so you can better utilize the New World Quantitative 4.0 investment decision system and enhance your investment decision-making skills
Ladies and gentlemen., a busy week of work has come to an end, and a wonderful weekend is approaching. I encourage every member of our community to take some time this weekend to gather with family and friends, to feel and cherish the beautiful moments in life, and to create warm memories together. At the same time, I hope everyone can also prepare for the new wealth journey next week while enjoying some relaxing time, ready to embrace new opportunities and challenges
Have a great weekend, see you next week